How to Save, Export, and Share in Chart Studio
How to save your work and share it.
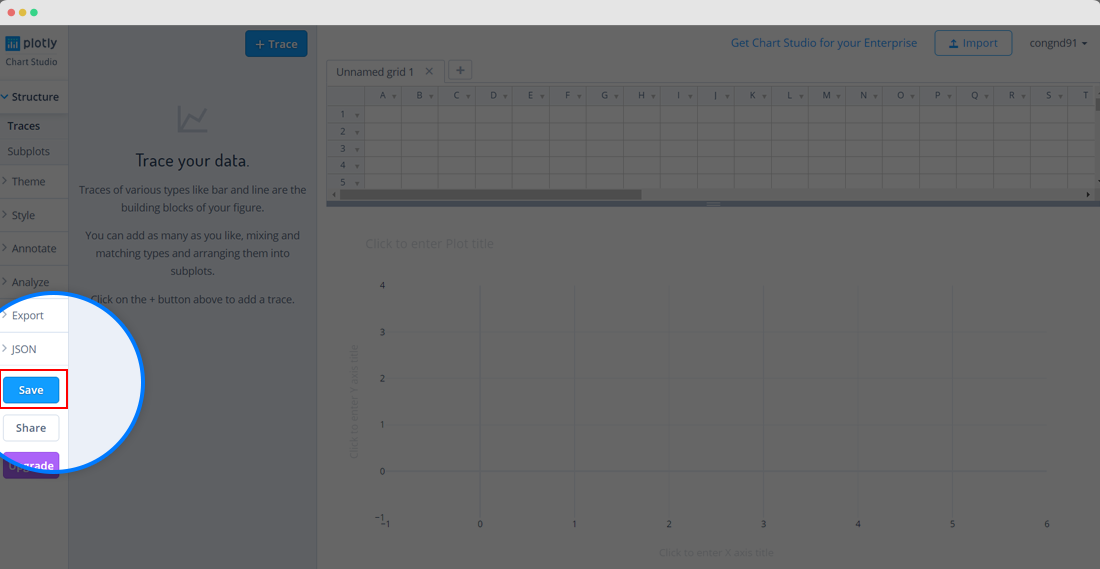
Save Your Plot
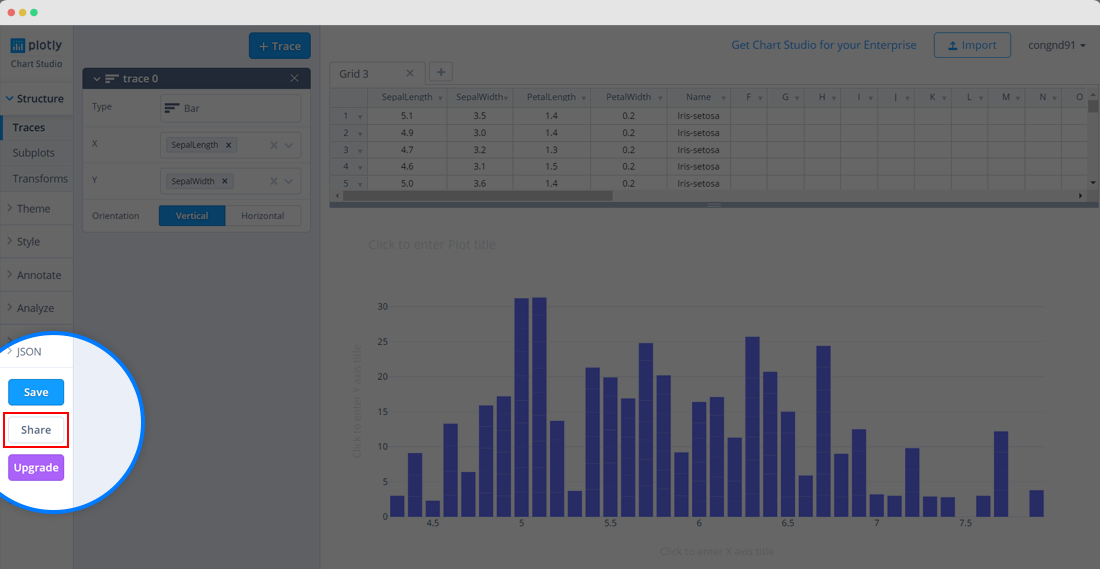
Once you have your data and plot ready to go, click on SAVE on the left-hand side.
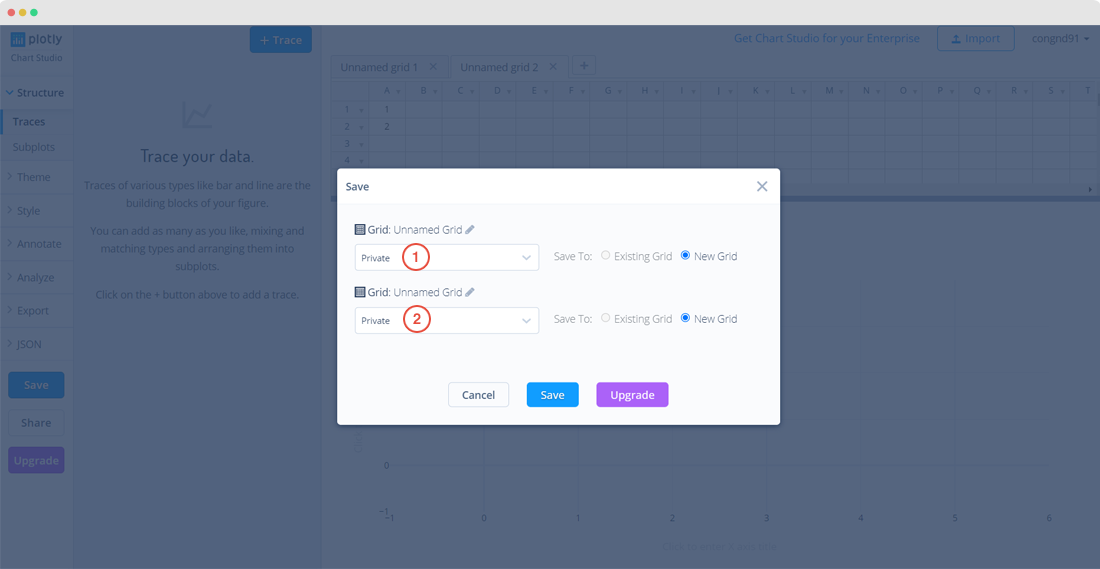
Give your PLOT and DATA a filename and select the privacy setting. For more information on how sharing works, including the difference between private, public, and secret sharing, visit this page.
Export Your Plot as a Static Image
Once you’ve saved your plot, you can export it as an image or an HTML file.
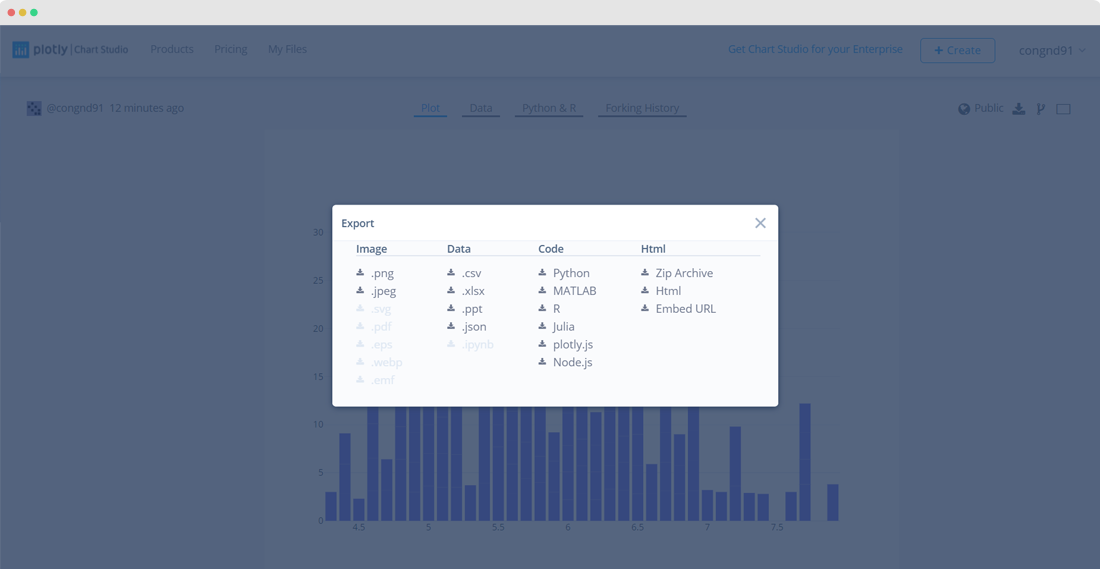
Save it as a PNG, or if you wish to save it as a PDF, SVG or ESP, click here to upgrade your account. If you want to download the .jpeg version, visit your Viewplot and click on the blue 'Export' at the top right-hand side of your plot and select it in the popup menu.
Choose the size as displayed, or the custom size of your chart.
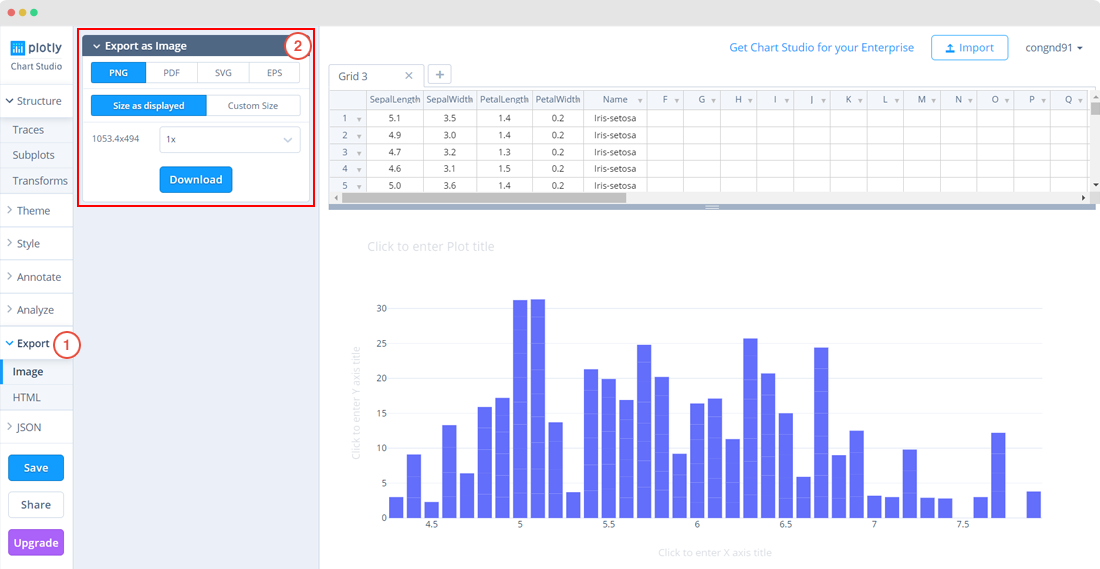
Click on DOWNLOAD to save it onto your computer.
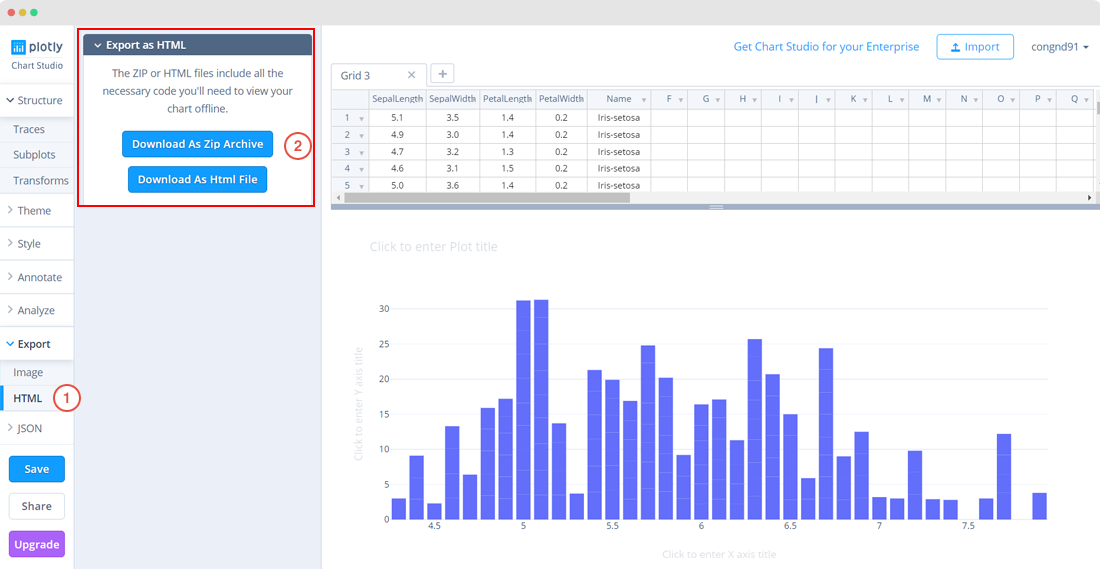
Export Your Plot as an HTML file
When you hit the HTML tab in this same panel under 'Export', you have the option of selecting DOWNLOAD AS ZIP ARCHIVE or DOWNLOAD AS HTML FILE.
Export Your Data
To export your data in a CSV or Excel file, visit your Organize page. You can also locate it by typing the following on your address bar: 'http://plot.ly/~YOURUSERNAME'. This is your Profile page. Hover over your plot and click VIEW.
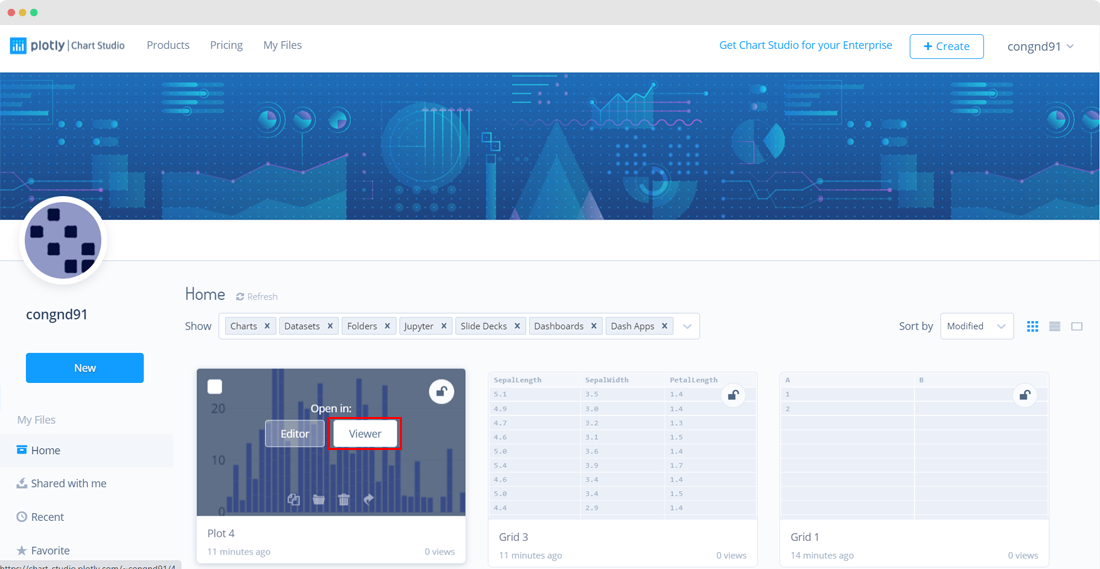
Click on the blue 'Export' button just above your plot, then select '.csv' or '.xlsx' from the popup menu.
Your files will download to your device.
Share Your Plot
You can share your plot in different ways.
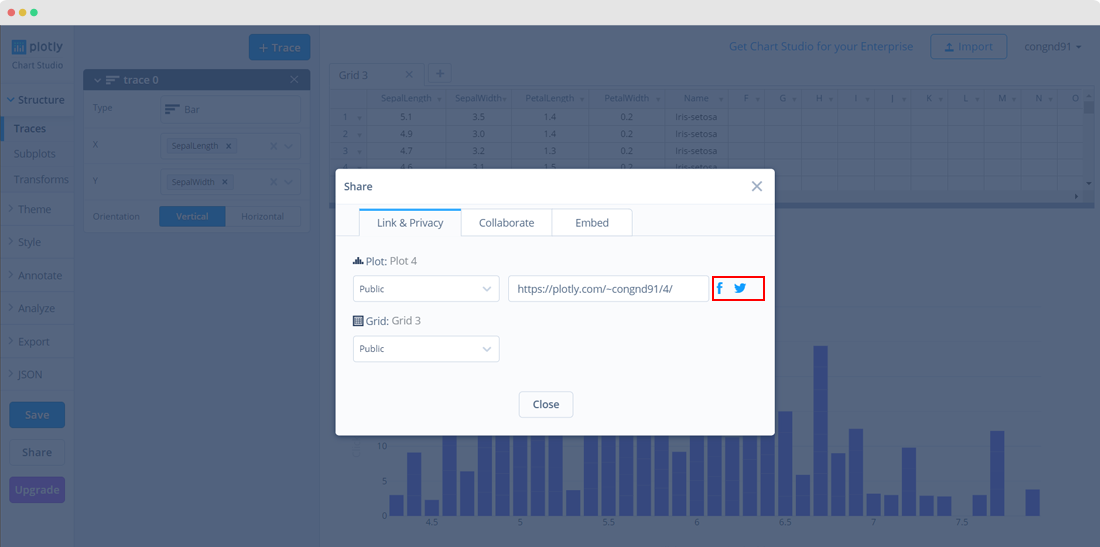
When you click on the SHAREABLE LINK tab, you can copy the URL and send it to others so they'll be able to view your plot.
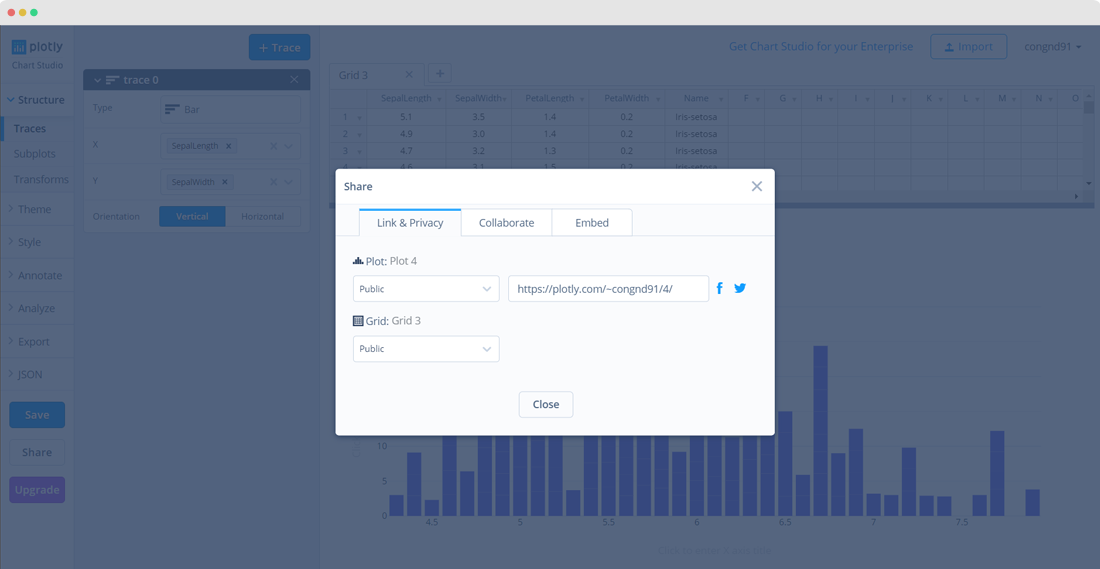
If you want to add collaborators, simply invite them by adding their information with optional message in the fields, then click ADD. For more information on collaborating, visit this page.

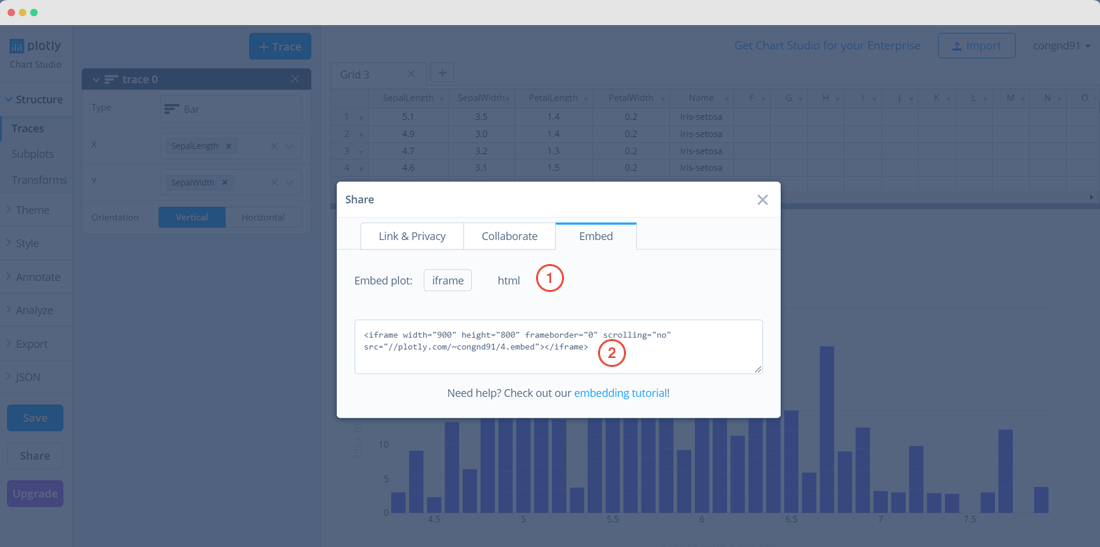
The EMBED tab will give you a link so you can add it to a website. You have the option of embedding your plot as an HTML snippet or iframe. For more information on how to embed your plot in a blog or website, click here.
Last but not least, you can also share your plot on social media! Simply click on the Facebook, Twitter, and Google Plus icons.
Love the graphs that are featured on this page? Check out our tutorials to learn how to create really cool plots!