Make a Bubble Map Online with Chart Studio and Excel
Bubble maps with Chart Studio
Upload your Excel data to Chart Studio's grid
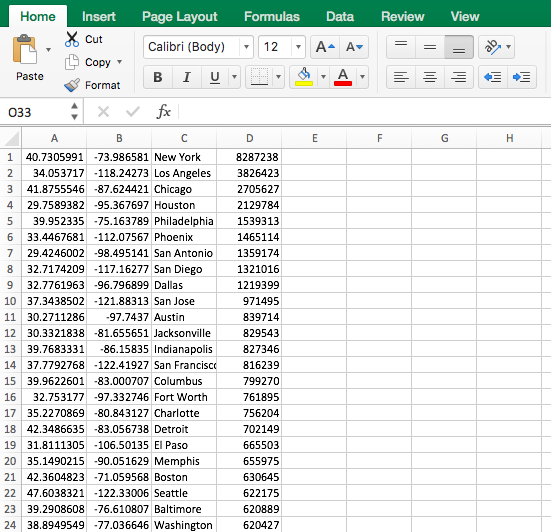
Open the data file for this tutorial in Excel. You can download the file here in CSV format
Head to Chart Studio
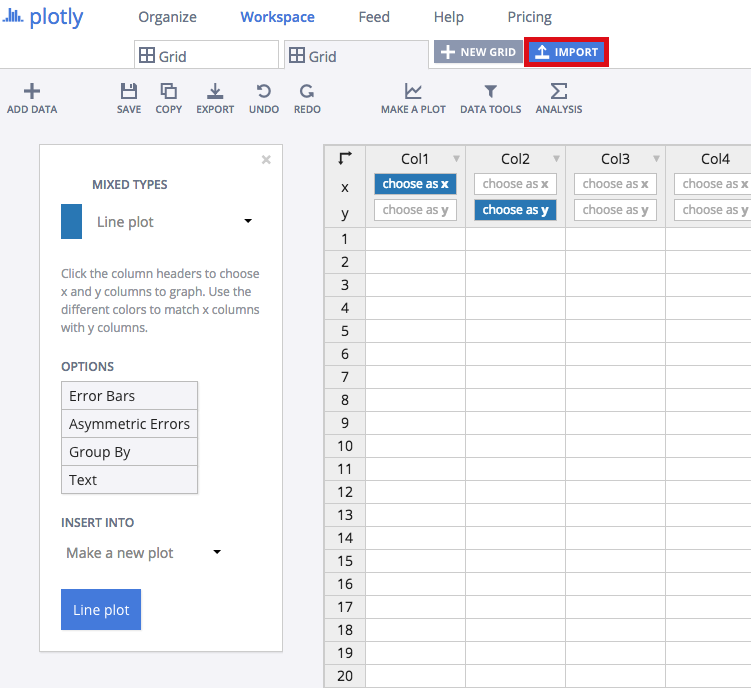
Head to the Chart Studio Workspace and sign into your free Chart Studio account. Go to 'Import', click 'Upload a file', then choose your Excel file to upload. Your Excel file will now open in Chart Studio's grid. For more about Chart Studio's grid, see this tutorial
Creating Your Chart
Head to the 'MAKE A PLOT' dropdown and select 'Bubble map.' Label your columns like we did below. You'll have a column for latitude and longitude. Then, click both the 'Size By' and 'Text' options on the left; assign 'Text' to the city and 'Size By' to the population.

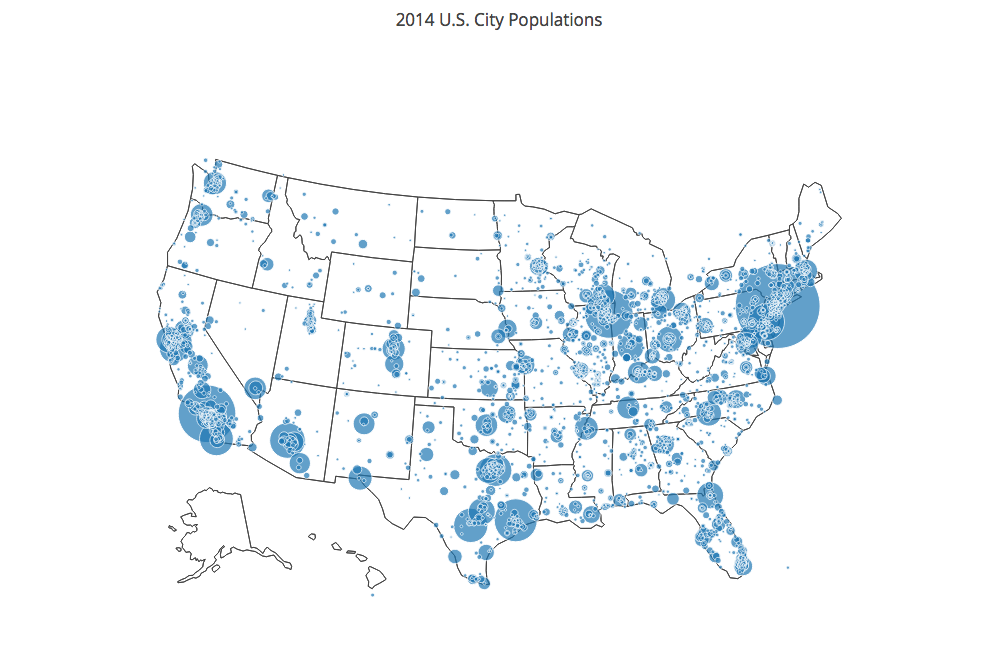
Your plot would initially look something like this.
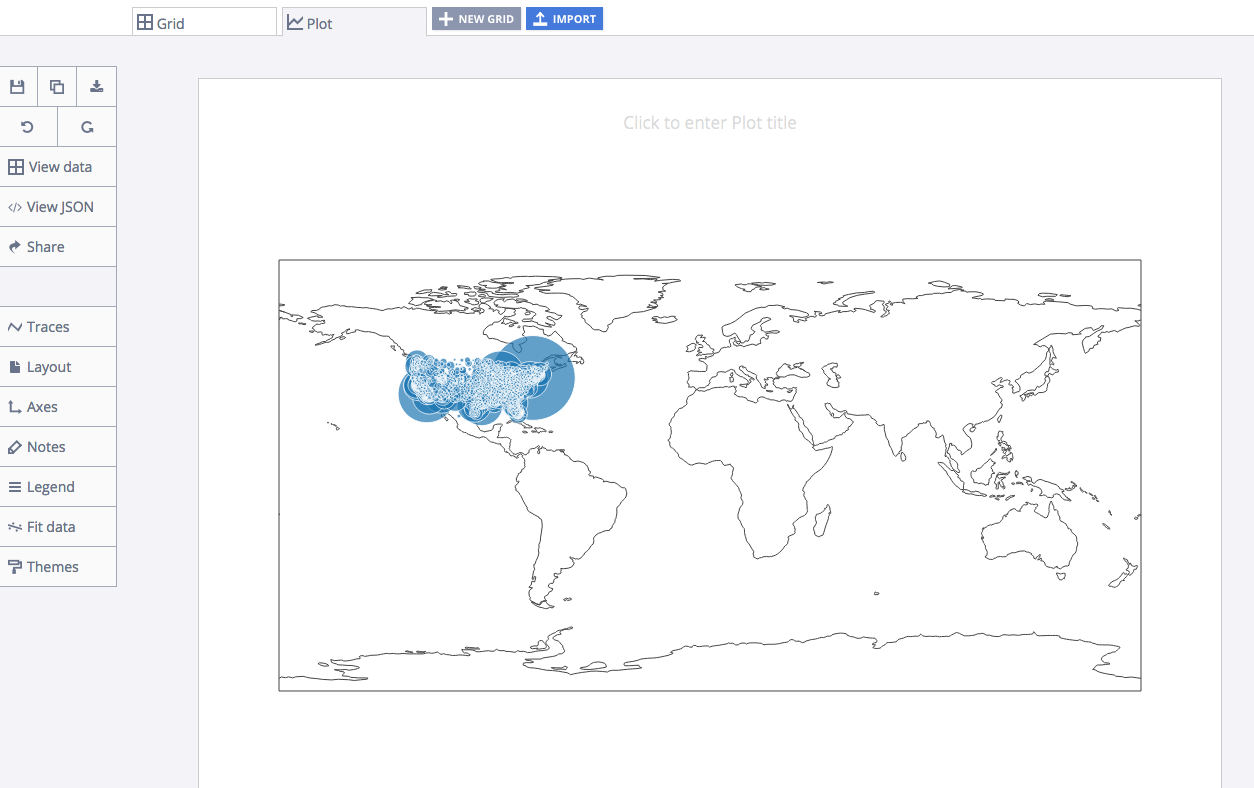
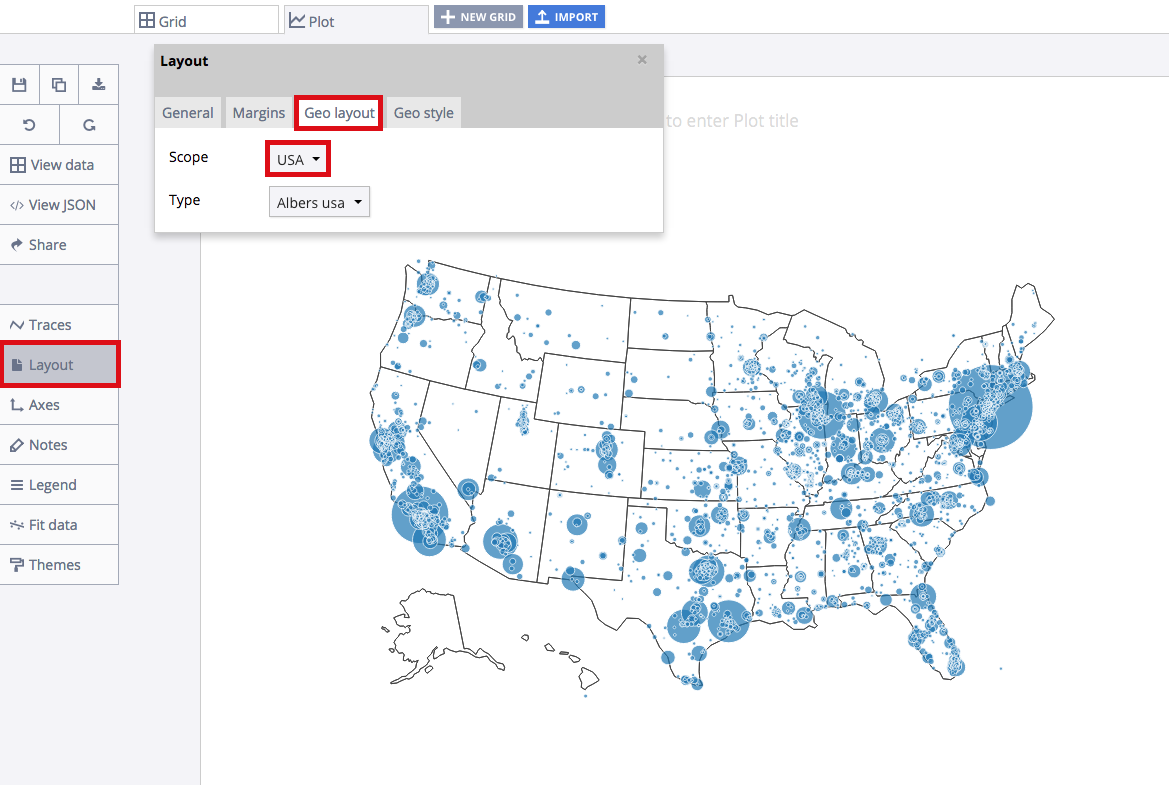
Since our data only encompasses the U.S., we can change the map layout to focus on the Lower 48, Alaska and Hawaii. Head to the LAYOUT popover, then select the 'Geo layout' option and select 'USA' within the scope dropdown.
Finalizing Your Graph
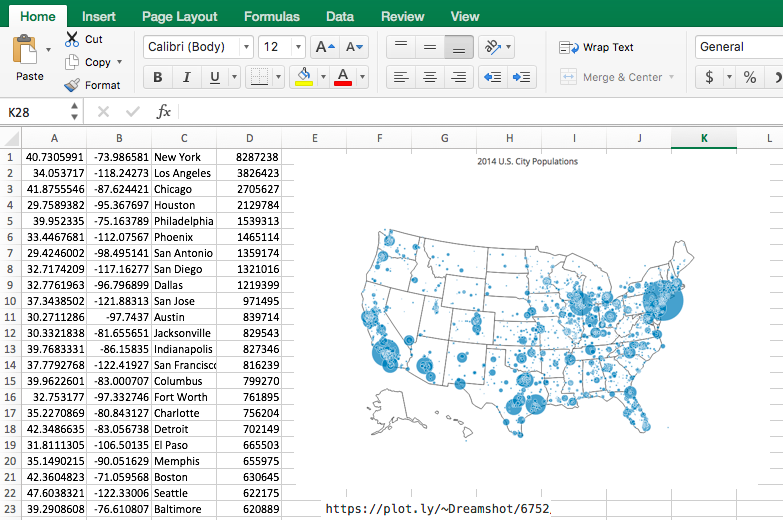
We’ve titled our chart. You can too. We came up with '2014 U.S. City Populations.'
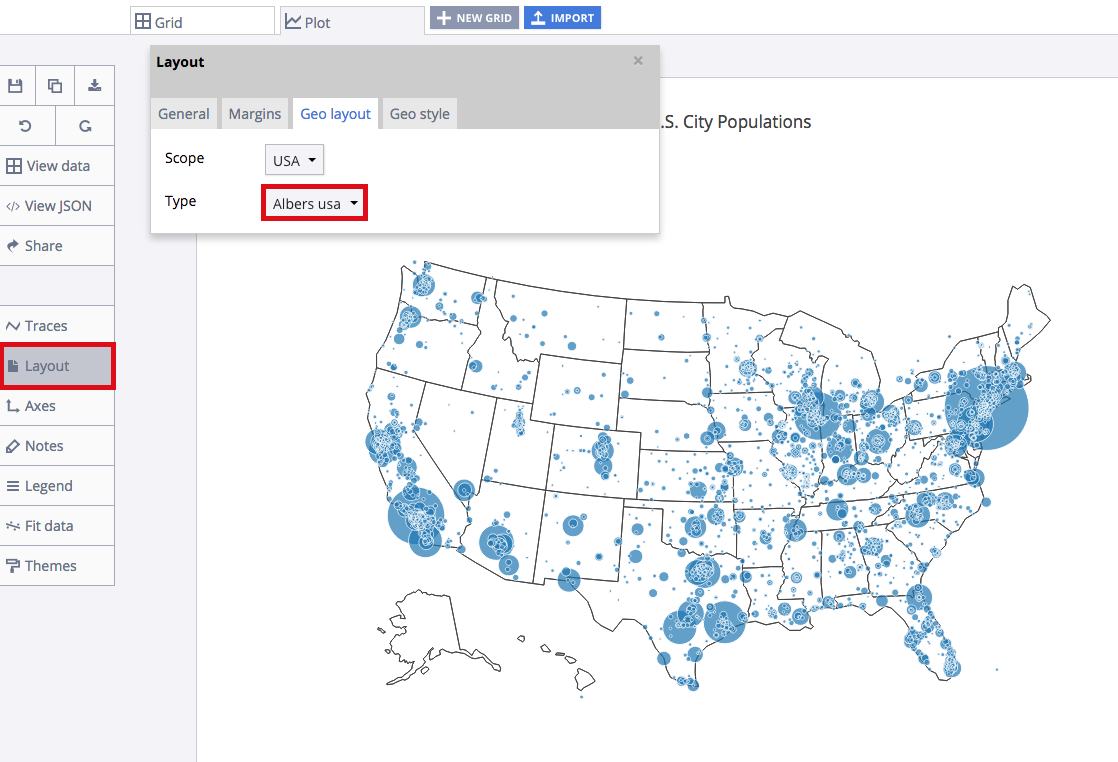
You can just the 'Type' of layout within the dropdown. We suggest going with 'Albers usa' for this plot.
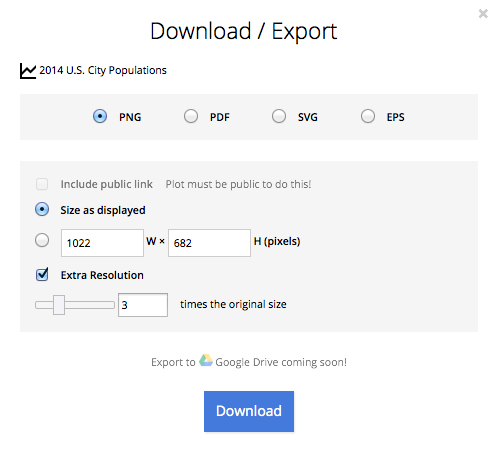
You can download your finished Chart Studio graph to embed in your Excel workbook. We also recommend including the Chart Studio link to the graph inside your Excel workbook for easy access to the interactive Chart Studio version. Get the link to your graph by clicking the 'Share' button. Download an image of your Chart Studio graph by clicking EXPORT on the toolbar.
To add the Excel file to your workbook, click where you want to insert the picture inside Excel. On the INSERT tab inside Excel, in the ILLUSTRATIONS group, click PICTURE. Locate the Chart Studio graph image that you downloaded and then double-click it. Notice that we also copy-pasted the Chart Studio graph link in a cell for easy access to the interactive Chart Studio version.